The ArcGIS Map
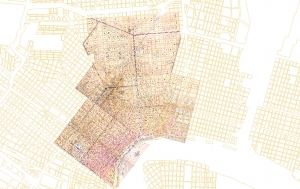
The current map shows 567 student address information our of the total number of 658 student data entries from the 1877 Fillmore School Register. 89 students are missing from the map due to the inadequate residential information from the original record.
How I Made the Map
The 1877 Fillmore School register has 658 student data entries and contains the address information for most of the students. This extensive data motivated me to make a digital interactive map of the students using ArcGIS. In order to locate students’ addresses, I sought a pre-1895 historical map of New Orleans as the house numbering changed in that year. Among some choices, I selected the Robinson Atlas, published in 1883 for a fire insurance company. The Robinson Atlas is not only one of the oldest citywide block-by-block maps, but also includes house number information for many neighborhoods. Furthermore, the Notary Archives (the Clerk of Civil District Court for the Parish of Orleans, Research Center) have digitized the map files online and made them available to researchers.
Transcription of the School Register
Before creating a map, I needed to transform the school register into digital data. I created a data dictionary to establish transcription rules and set up a google drive to store and share the data with the project team. I made a special notation of those who were “transferred to colored school” due to the school board decision to resegregate the Fillmore School as white-only in 1877.
The 1870 and 1880 Census Research
The transcribing process suggested to me that there are more students of Creoles of color who were not recorded as “transferred.” This motivated me to study the 1880 census information for each student. The 1880 census was the first record that contained house numbers and street names for each household, and it helped me identify the matching student data from the census. As I did in the transcription process, I set rules and guidelines for the census information to increase accuracy. The 1880 census information was added to the school register data.
Additionally, I used the 1870 census for some students. It is because some Creole students of African descent were not noted as transferred and were classified as white in the 1880 census. These cases show the complex racial identities and the impracticability of the color line in New Orleans history.
As a result, the information from the register (Name, Age, Birthplace, Address, Date of Admission, Parent or Guardian’s Name, Occupation and Remarks) and the racial information from the 1880 census (and the 1870 census) became the substance for the map.
Turning the Robinson Atlas into a Projected Map
Georeferencing the Robinson Atlas
The Robinson Atlas images were divided into more than thirty different plates and were un-projected. In order to make a geo-spatial analysis possible in the future, I geo-referenced the Robinson Atlas by layering it over contemporary New Orleans square and street shape files offered by Data.NOLA.gov
City Directory Research
Some students did not have specific address information (i.e. corner of A street and B street) or only have addresses without house numbers. In these cases, I looked for additional information from city directories published between 1874 and 1880. If I found more specific data, I prioritized the city directory data to the original address information.
Making Points in the ArcGIS
Based on the information from the school register and the city directory, the project team made markers for each student’s house. The team used the house numbering information from the Robinson Atlas and also referred to the Alphabetical and Numerical Index of Changes in Street Names and Numbers, Old and New, 1852 to Current Date [1938] when the Atlas does not offer precise information.
Results
So far the beta map shows 567 student data entries. I prioritized to show as much student data as possible, therefore some students seemed crowded into strange locations, like in the middle of the street! In such cases, click icons for more student information. You will see the degree of accuracy in the map data along with other information from the school register and census.
Map Components
Currently, there are seven map components. Each component can be switched on or off.
- Robinson Atlas: shows the geo-referenced Robinson Atlas map plates: 6-9, 18, 19, and 21-23.
- School Boundary: shows the Fillmore School district of 1877.
- Fillmore School Location: shows the location of the Fillmore School.
- Fillmore School Students: shows markers based on the Fillmore School students’ address data.
- Students Transferred to ‘Colored School’: shows students who were noted as “transferred to colored school” in the 1877 Fillmore School register.
- Black or Mulatto Students (1880 Census): shows students who were classified as either ‘black’ or ‘mulatto’ in the 1880 Census.
- Black or Mulatto Students (1870 Census): shows students who were mentioned as ‘black’ or ‘mulatto’ in the 1870 Census, but not necessarily identified as such in the 1880 Census.
Click markers to learn more about student’s information!